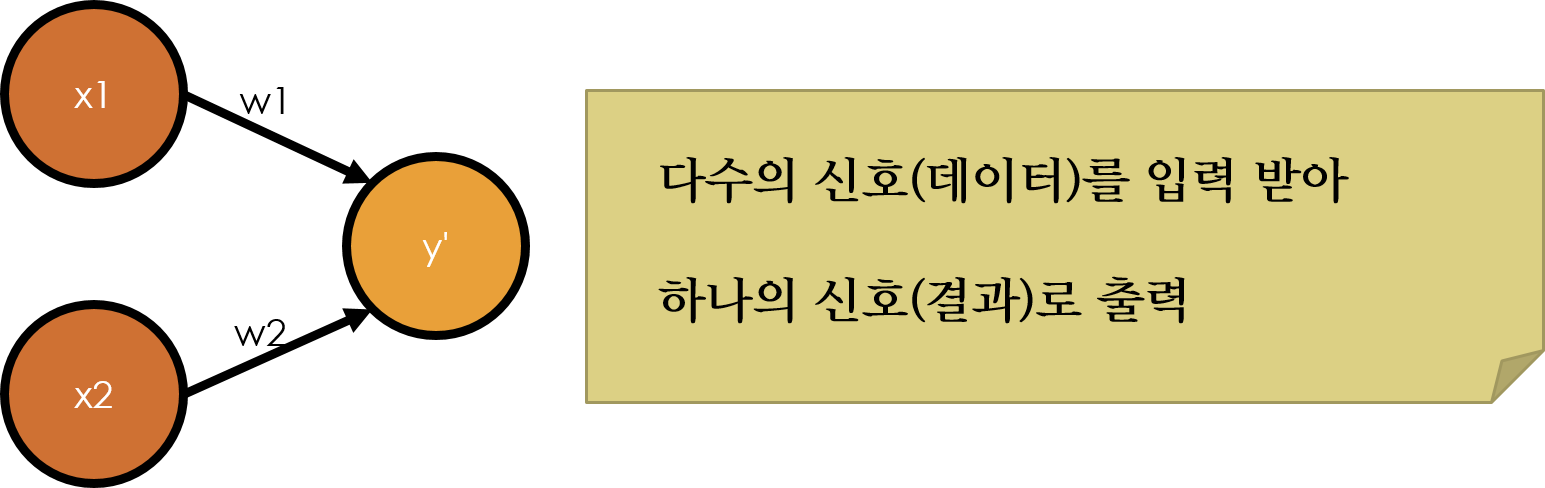
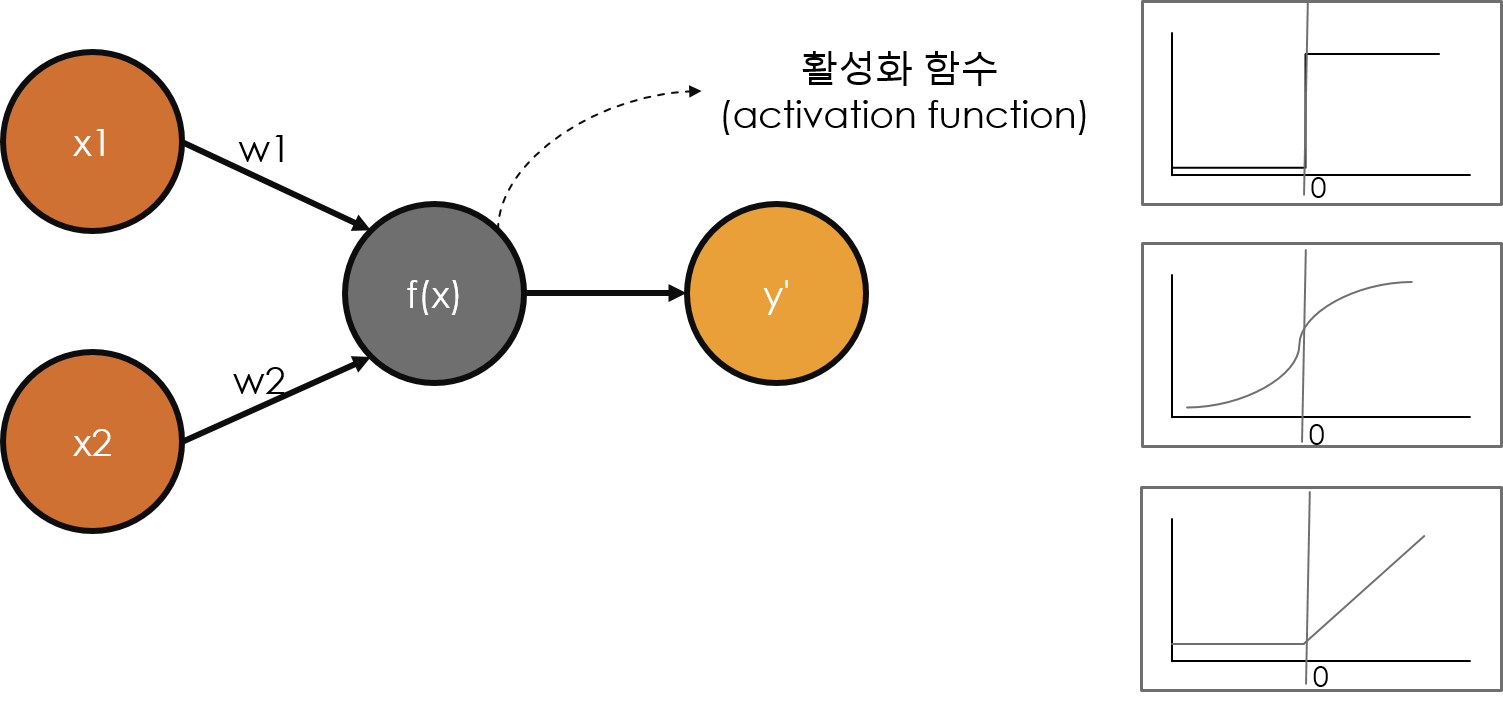
활성화 함수(Activation function)의 신호 전달
In [1]:
# 간단한 활성화 함수 예시 만들어 보기 1
def actv_fcn_ex1(x):

    # 10보다 큰 신호는 전달하지 않는다
    if (x >= 10):
        x = 10
    else:
        x = x

    # 0 보다 작은 신호는 전달하지 않는다
    if (x <= 0):
        x = 0
    else:
        x = x

    return(x)
In [2]:
actv_fcn_ex1(5)
Out[2]:
In [3]:
actv_fcn_ex1(15)
Out[3]:
In [4]:
actv_fcn_ex1(-10)
Out[4]:
In [5]:
# 간단한 활성화 함수 예시 만들어 보기 2
def actv_fcn_ex2(x):

    # 10보다 큰 신호는 10으로 전달
    if (x >= 10):
        x = 10
    else:
        x = x

    # 10 보다 작은 신호는 0으로 전달
    if (x < 10):
        x = 0
    else:
        x = x

    return(x)
In [6]:
actv_fcn_ex2(5)
Out[6]:
In [7]:
actv_fcn_ex2(15)
Out[7]:
In [8]:
actv_fcn_ex2(-10)
Out[8]:
1) Rectified Linear Activation (ReLU)
In [9]:
# relu activation function
# rectify: 직류로 바꾸다, 고르게 하다..


import matplotlib.pyplot as plt

# rectified linear function 만들기
def rectified(x):
    return max(0.0, x) # 0보다 큰 수만 전달

# 입력 신호의 예시 -10 ~ 10
inputs = [x for x in range(-10, 10)]

# 입력신호의 예시를 이용한 그래프 그려보기
outputs = [rectified(x) for x in inputs]

# plot inputs vs outputs
plt.plot(inputs, outputs)
plt.show()

2) Sigmoid (Logistic)
In [10]:
# sigmoid activation function


from math import exp
import matplotlib.pyplot as plt

# sigmoid activation function 만들기
def sigmoid(x):
    return 1.0 / (1.0 + exp(-x)) # 극한의 값은 0과 1 사이의 값으로..

# 입력 신호의 예시 -10 ~ 10
inputs = [x for x in range(-10, 10)]

# 입력신호의 예시를 이용한 그래프 그려보기
outputs = [sigmoid(x) for x in inputs]

# plot inputs vs outputs
plt.plot(inputs, outputs)
plt.show()

3) Hyperbolic Tangent (Tanh)
In [11]:
# tanh activation function

from math import exp
import matplotlib.pyplot as plt

# tanh activation function 만들기
def tanh(x):
    return (exp(x) - exp(-x)) / (exp(x) + exp(-x))

# 입력 신호의 예시 -10 ~ 10
inputs = [x for x in range(-10, 10)]

# 입력신호의 예시를 이용한 그래프 그려보기
outputs = [tanh(x) for x in inputs]
# plot inputs vs outputs
plt.plot(inputs, outputs)
plt.show()

활성화 함수 한눈에 비교
In [12]:
from math import exp
import matplotlib.pyplot as plt

# tanh
def tanh(x):
    return (exp(x) - exp(-x)) / (exp(x) + exp(-x))

# sigmoid
def sigmoid(x):
    return 1.0 / (1.0 + exp(-x))

# ReLu
def rectified(x):
    return max(0.0, x)

# 입력 신호의 예시 -10 ~ 10
inputs = [x for x in range(-10, 10)]

# 입력신호의 예시를 이용한 그래프 그려보기
tanh_outputs = [tanh(x) for x in inputs]
sigmoid_outputs = [sigmoid(x) for x in inputs]
ReLu_outputs = [rectified(x) for x in inputs]

fig, ax = plt.subplots()
plt.plot(inputs, tanh_outputs, '-.b', label='tanh')
plt.plot(inputs, sigmoid_outputs, 'r', label='sigmoid')
plt.plot(inputs, ReLu_outputs, '--y', label='ReLu')
leg = ax.legend()
plt.show()

In [13]:
# ReLu를 제외한 tanh와 sigmoid 만 비교
fig, ax = plt.subplots()
plt.plot(inputs, tanh_outputs, '-.b', label='tanh')
plt.plot(inputs, sigmoid_outputs, 'r', label='sigmoid')
leg = ax.legend()
plt.show()

END code
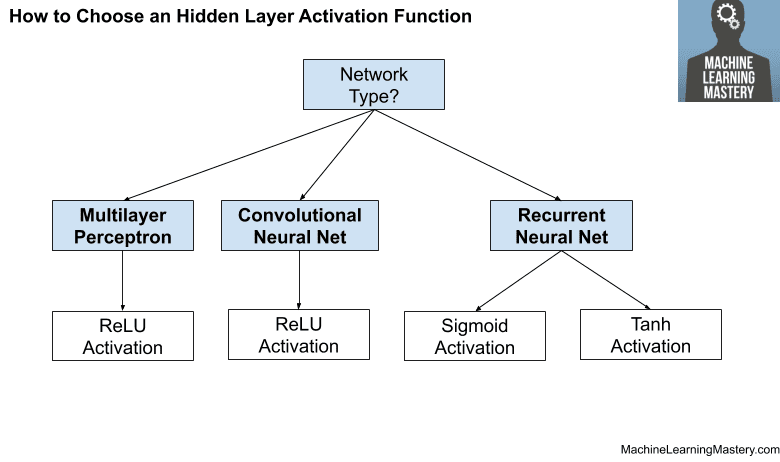
부록) 모델에 따른 (은닉층) 활성화 함수 예시
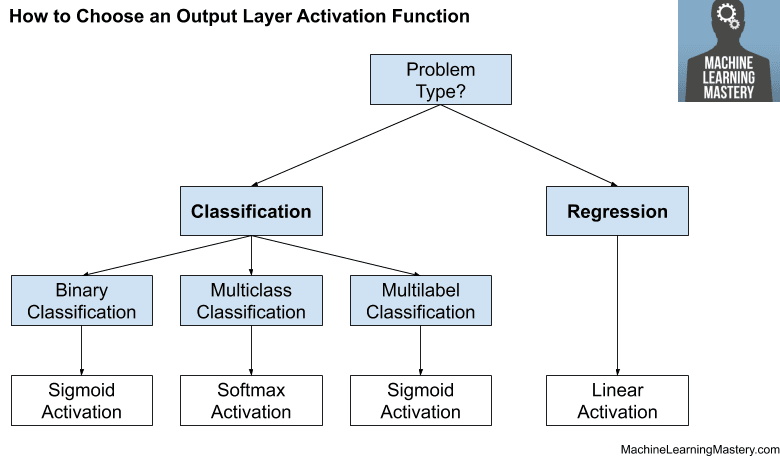
부록) 모델에 따른 (출력층) 활성화 함수 예시